
Moneyball in the Contact Centre
Find out what three traditional contact centre metrics might be holding you back and explore a new way to look at contact centre metrics.
Watch the video below to learn more.
Why Contact Centres Need to Play “Moneyball”
“Buy what is undervalued and sell what is overvalued.”
That’s a pretty simply philosophy that when deployed correctly will help any organisation succeed. But how do you find out when something’s perceived value is different from its actual value? That’s the hard part, especially in the contact centre. Luckily there is actually a blueprint we can follow and surprisingly it comes from sports. Don’t believe me? Give me – say 5 minutes – to make my case:
- 2 minutes to explain the original moneyball blueprint (0:40-2:59)
- 2 minutes to apply this blueprint to the contact centre (3:00-6:21)
History of Moneyball
Let me show you two graphs to illustrate why this sports blueprint is worth following. Here are the wins for totals for the top two MLB team from 2000-2006. Which team do you think performed better during this time-frame? Most people would say the blue team but it’s pretty close. Here is the amount of money these teams spent on their rosters each year. The blue team, New York Yankees, had slightly higher win totals but spend about three times as much, as the green team, Oakland Athletics.
Compared to the league, I’d say both were successful. However, let’s dive into how the A’s spend around ¾ of a billion dollars less on players, but still had the 2nd highest win total. It all goes back to that simply philosophy of “buy what’s undervalued and sell what is overvalued.”
In the early 2000, power hitters were all the rage. Even if you are not a sport fan, you probably remember seeing news clips of Barry Bonds during this time when he shattered the homerun record. So, do you want to guess what clubs were overpaying for? Yup home runs, hitting the ball out of the park, and RBI, or runners the batter allowed to score on his hit.
How the A’s Did It
The A’s looked at the stats that most teams were not paying attention to OPS, or on-base percentage which is basically the percentage of times you get on base – so a walk and a single count the same. The A’s also helped create new stats like OBS, on-base percentage plus slugging and WAR, or win above replacement, which looks at a player’s performance compares to an average player in that position. The athletics constructed their team by finding players strong in undervalued stats while they avoided paying for the players with strong in overvalued stats.
The result was this – New York Yankees stuck in the old ways and overspending – while the Oakland Athletics were on cutting edge of data and analytics to efficiently produce results. That winning blueprint, which if you didn’t know is called Moneyball.
Now let’s use that lens to look at the modern contact centre.
Overused Metrics in the Contact Centre
I’d say most contact centres are putting too much of an emphasis on three metrics:
- Adherence – How closely one of your agent sticks to their schedule
- Conformance – How closely one of your agent’s time spent answering calls compares to what they were scheduled to do
- 1st Call Resolution – How many of your customers did not call back for additional help on this issue
All three of these stats do have some value, but they are generally overvalued. Part of this overvaluation is because these stats are easy to access – what WFM product doesn’t give you schedule adherence for your agents – and to be honest they been around forever (since measuring contact centre).
Let me drive this point home by looking at an example. Yes, I want my agents to stick to their schedules, but what is better for an organisation? An agent with low adherence because they stick with frustrated customers even when their break starts… OR an agent with high adherence because they abruptly end calls or go into “not ready early” to stick to their schedule.
The same is true for conformance. An agent was on the phone for the right amount of time but who knows if they were any good at it. What about 1st call resolution? A customer may never have called back because they gave up and found help elsewhere or canceled. Of course, if all you have are these basic stats, use them as they are valid data. They just don’t tell the complete story of what’s going on.
New Ways to Measure in Contact Centres
OK then what metrics SHOULD you be using if you want to move ahead of the competition?
- NPS and predictive NPS
Your overall net promoter score indicates how happy customer are with your business so why not judge agent on how happy they make customers. Yes, occasionally an agent will a call that no amount of expertise can salvage but when taken as part of all calls it becomes easy to spot which agents give great customer experience and which agent just answer calls. - Evaluation score
Every group’s evaluations are going to be different but at there core evaluation forms should look at two areas: positive impact the customer experience and legal compliance. Whether on a 10-point scale or 200-point scale good evaluations allow both agents and their supervisors fairly gauge how well folks are doing at putting the customer first while following the rules. - NPSAR or Net-promoter score above replacement
Have your analytics predict the NPS for all calls with the average agent from your organisation handling them. Then compare that average score with what the agent actually did. A +2 would mean this agent improved the NPS by two whole places on the NPS scale while a -.5 would mean they did worse than the average agent. - EAR, evaluation above replacement
Take the predicted evaluation score for this call with an average agent and compare it to how the agent actually did. Again positive # would be good and negative would be not so good.
Forget the Old Ways of Measuring Success
Unless you want to be left behind, don’t get stuck in the old ways of seeing and measuring success. Instead get out of your comfort zone and start using data and analytics to efficiently produce results. For more forward-thinking ideas about the use of technology, watch more videos below or check out Calabrio’s Resource Centre.
Watch more Microlearning Videos from Calabrio
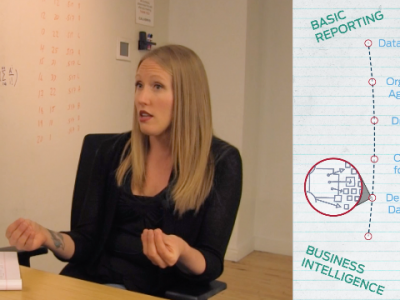
Every other Thursday someone from the Innovation Design team helps make analytics and data consumable for all. This week we tackle how to move from reporting to BI.
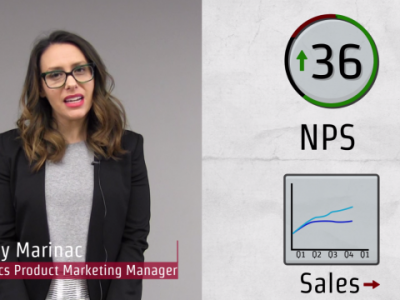
Discover how analytics can help your company avoid major missteps when your improving NPS doesn’t match your stagnate sales numbers.

You don’t need a data scientists to effectively run an analytics program. Learn the five most important traits to look for when hiring a data analyst.

Find out what three traditional contact center metrics might be holding you back and explore a new way to look at contact center metrics.