The Learning Studio
Your easy, free, video-based pathway to upskill every Calabrio ONE user in your contact center.
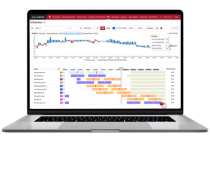
The Learning Studio is a fun, exciting way for contact center workers to learn new skills and improve their existing ones. That’s because we design our visually rich, snackable courses—available on-demand at absolutely no cost to you—according to the way people like to consume content on popular video platforms like TikTok and YouTube.
But we didn’t stop there. In addition to step-by-step instructions on the best ways to use Calabrio ONE, we also offer courses that can expand each student’s overall understanding of the entire contact center environment—knowledge designed to help agents quickly and efficiently gain the advanced skills they’ll need to become supervisors.
With The Learning Studio
Agents/Employees can:
Achieve Calabrio ONE proficiency faster than ever before
Become more efficient, effective, and knowledgeable in their work
Advance their careers with new skills and a deeper understanding of CX operations
Experience greater engagement and job satisfaction
Managers/Directors can:
Ensure a quicker time-to-value for Calabrio ONE
Improve new-hire onboarding
Reduce employee turnover
Spend much less on live training
Sample Course
Creating Effective Contact Center Reporting
Understanding how to create efficient, effective contact center reporting can be a challenge. Choosing the right KPIs, clearly communicating results, getting the right information to the right audience- it’s a lot to manage! This course will teach you the skills you need to build reports that quickly communicate relevant insights in support of your business goals.
| UNIT 1 Principles of Data Visualization |
UNIT 2 Selecting the Right Data |
UNIT 3 Reporting Across Contact Center Audiences |
UNIT 4 Next Steps |
|---|---|---|---|
| Why Data Visualization Is Important | Business Objectives and Metrics | Reporting and Dashboards for Agents | Dashboard Starter Guide (PDF) |
| General Best Practices for Data Visualization | Actionable Data | Reporting and Dashboards for Team Leaders | |
| Bar and Column Charts | Watch Out for Zombies! | Reporting and Dashboards for Quality Management Analysts | |
| Word Clouds | Think Like Your Audience | Reporting and Dashboards for Forecasters and Schedulers | |
| Line and Area Charts | Reporting and Dashboards for Executives | ||
| Pie Charts | |||
| Scatter Plots | |||
| Gauge Charts and Headlines | |||
| Dashboard Design |
See All Courses
We continually develop new courses and pathways, so check back often!
